Behavioral Analytics for UI/UX Optimization
What you'll learn
 Behavioral AnalyticsPlayer Churn IdentificationUI/UX OptimizationA/B Testing Strategies
Introduction to Player Engagement and Longevity
Merely attracting players is no longer sufficient; retaining them and fostering long-term engagement is paramount to a game's success. Player churn, the phenomenon where players stop playing a game, represents a significant challenge for developers. Understanding why players leave and proactively addressing these "churn points" can dramatically improve player longevity and ultimately, a game's profitability. This article will delve into how behavioral analytics provides the necessary insights to identify these critical junctures and how strategic UI/UX adjustments, rigorously tested, can transform a fleeting experience into a lasting relationship.
The Anatomy of Player Churn
Player churn isn't a singular event but often a gradual process influenced by various factors. It can be triggered by frustration with game mechanics, a lack of perceived progress, social disengagement, or simply a cluttered or confusing user interface. Identifying the specific moments or patterns leading to disengagement is the first crucial step.
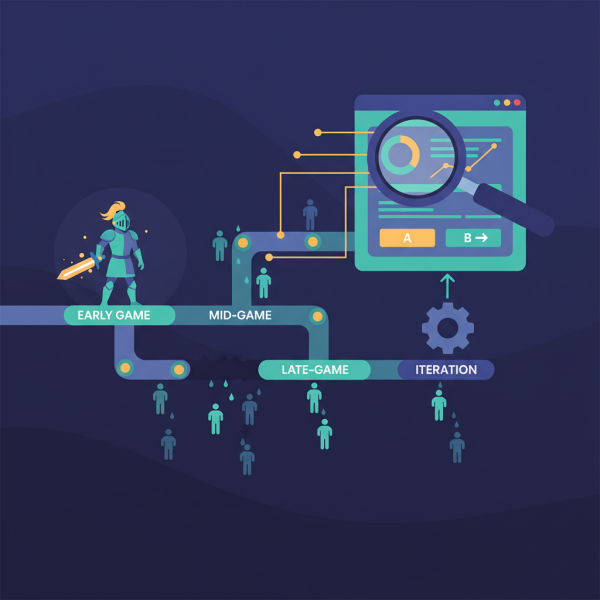
Churn can manifest in different forms:
- Early Churn: Players leaving within the first few hours or days, often due to poor first impressions, difficult onboarding, or unengaging early game loops.
- Mid-Game Churn: Players who complete the initial phases but drop off as the game becomes repetitive, too challenging, or lacks compelling new content.
- Late-Game Churn: Experienced players who eventually run out of content, reach a perceived "end-game," or find new games to play. While often inevitable, reducing early and mid-game churn offers the most significant impact.
Leveraging Behavioral Analytics
Behavioral analytics involves collecting, processing, and analyzing data about how players interact with your game. This isn't just about what they do, but how often, where, and in what context. Robust analytics tools are essential for transforming raw data into actionable insights.
Data Collection Strategies
Effective behavioral analytics begins with comprehensive data collection. This includes:
- Event Tracking: Logging specific actions like login/logout, tutorial completion, level progression, item acquisition, combat encounters, menu navigation, and social interactions.
- Player State Tracking: Recording player inventory, currency, skill levels, quest progress, and demographic information (if applicable and consented).
- Session Data: Time spent in game, session frequency, and duration.
- System Data: Device type, operating system, and connection quality, which can sometimes impact player experience.
The goal is to paint a complete picture of the player's journey, from their first launch to their last log-off.
Identifying Critical Churn Points
Once data is collected, the next challenge is to identify patterns indicative of impending churn. This involves several analytical techniques:
Player Journey Mapping
Visualize the typical paths players take through your game. Look for common drop-off points in tutorials, specific levels, or quest lines. Where do players consistently get stuck or quit?
Funnel Analysis
Define key progression funnels, such as "download to first boss," "tutorial completion to multiplayer match," or "accessing the in-game store to making a purchase." Analyze conversion rates at each step to pinpoint bottlenecks where players abandon the flow.
Segmentation
Group players based on similar behaviors (e.g., highly social players, solo explorers, spenders, non-spenders). Analyze churn rates within these segments. A UI element that frustrates new players might not bother veterans, for example.
Predictive Modeling
Advanced analytics can use machine learning to identify early warning signs of churn based on accumulated player behavior patterns. This allows for proactive interventions before a player decides to leave.
UI/UX Layout Testing for Improved Longevity
With churn points identified, the focus shifts to designing and testing solutions. Often, UI (User Interface) and UX (User Experience) elements are direct levers for improvement.
Hypothesis Generation
Based on your analytics, formulate clear hypotheses. For instance: "If we simplify the inventory management screen (UI) and provide clearer item descriptions (UX), new players will be less overwhelmed and have a higher retention rate in their first week."
A/B Testing
A/B testing is a powerful method for validating hypotheses. Create two (or more) versions of a UI/UX element – a control (current version) and one or more variants (new designs). Randomly assign players to experience one version. Crucially, measure the impact on your identified churn metrics (e.g., retention, time to churn, progression rates).
Iterative Design Process
UI/UX improvement is rarely a one-shot fix. It's an iterative process:
- Analyze: Identify a churn point using behavioral analytics.
- Hypothesize: Propose a UI/UX change to address it.
- Design: Implement the proposed change.
- Test: A/B test the new design with a subset of players.
- Evaluate: Compare performance metrics against the control.
- Implement/Refine: Roll out successful changes broadly or refine based on test results and re-test.
Small, incremental changes to tutorial flows, menu navigation, quest log clarity, in-game notifications, or even the visual hierarchy of information can have significant cumulative effects on player comfort and, consequently, their willingness to continue playing.
Summary
Enhancing player longevity in video games is a continuous effort that thrives on a data-driven approach. By meticulously collecting and analyzing behavioral data, game designers can pinpoint exactly where and why players disengage – their "churn points." Armed with these insights, targeted UI/UX adjustments can be designed, rigorously A/B tested, and iteratively refined to create a more intuitive, engaging, and ultimately, more sticky player experience. This systematic methodology not only reduces player attrition but also fosters a more loyal community, ensuring the long-term success and growth of your game.
Comprehension questions
 What are the three main types of player churn discussed in the article, and how do they differ?Explain two key data collection strategies essential for effective behavioral analytics in video games.How does funnel analysis help identify churn points within a player's journey?Describe the iterative design process for UI/UX improvements, as outlined in the article.