Navigating Game Health and Player Engagement Through Data
- -->> 5. Navigating Game Health and Player Engagement Through Data
What you'll learn
 Key Performance Indicators (KPIs)Player Engagement AnalysisData Interpretation TechniquesActionable Insights from Game Metrics
Success in gaming is no longer solely determined by creativity and innovative gameplay; it's increasingly driven by data. Understanding how players interact with your game, identifying areas of strength and weakness, and making informed decisions requires a robust approach to metrics. This article delves into the crucial concept of "Metrics That Matter," guiding you through the identification of key performance indicators (KPIs) and the art of interpreting data to truly grasp your game's health and player engagement.
The Foundation of Game Health: What Are KPIs?
Key Performance Indicators (KPIs) are quantifiable metrics that reflect how effectively a game is achieving its business and operational objectives. They act as vital signs, providing a snapshot of the game's overall performance and highlighting specific areas that require attention. Unlike vanity metrics, which might look good but offer little actionable insight, KPIs are directly linked to strategic goals such as player retention, monetization, or community growth.
For a game developer, KPIs are more than just numbers; they are the language of player behavior. They translate complex user interactions into understandable data points, enabling teams to move beyond assumptions and make data-driven decisions. By establishing clear KPIs early in development, teams can create a framework for continuous improvement and strategic iteration.
Essential KPIs for Game Health and Engagement
A comprehensive understanding of game health requires looking at various facets of player behavior. Here are some fundamental KPI categories and examples that every game developer should consider:
Player Acquisition & Retention
- Daily Active Users (DAU) / Monthly Active Users (MAU): These metrics indicate the total number of unique players engaging with your game on a daily or monthly basis, respectively. They offer a broad sense of your game's reach and current popularity.
- Retention Rate: Measures the percentage of players who return to your game after a certain period (e.g., Day 1, Day 7, Day 30). High retention is critical for long-term success, as acquiring new players is often more expensive than keeping existing ones.
- Churn Rate: The inverse of retention, indicating the percentage of players who stop playing your game over a specific period. Identifying high churn points can highlight issues with early game experience or content gaps.
- User Acquisition Cost (UAC) / Cost Per Install (CPI): If you're running marketing campaigns, these metrics track how much it costs to bring a new player into your game.
Engagement Metrics
- Average Session Length: The typical duration a player spends in a single game session. Short sessions might indicate lack of depth, while extremely long ones could suggest grind or addiction.
- Number of Sessions per Day/Week: How frequently players return to your game. A high frequency often correlates with strong engagement and habit formation.
- Time Spent in Game: The cumulative amount of time players spend in your game over a given period, offering a broader view of overall player investment.
- Feature Usage: Tracking which specific game modes, features, or content players interact with most often. This helps validate design choices and identify popular or underutilized areas.
- Progression Rate: How quickly players advance through the game's content or levels. Stalling progression could point to difficulty spikes or confusing mechanics.
Monetization Metrics (for revenue-generating games)
- Average Revenue Per User (ARPU) / Average Revenue Per Paying User (ARPPU): ARPU measures revenue across all active players, while ARPPU focuses specifically on those who make purchases. These are crucial for understanding monetization efficiency.
- Conversion Rate: The percentage of players who make at least one purchase within your game.
- Lifetime Value (LTV): The projected revenue a single player will generate throughout their entire engagement with your game. A high LTV is a strong indicator of a sustainable business model.
Performance & Stability Metrics
- Crash Rate: The frequency of game crashes experienced by players. High crash rates severely impact player experience and retention.
- Load Times: How long it takes for the game or specific levels to load. Long load times can frustrate players and lead to abandonment.
Interpreting the Data: Beyond the Numbers
Collecting data is only half the battle; the real value comes from interpreting it correctly. Raw numbers without context can be misleading. Here’s how to gain meaningful insights:
Context is King: Always compare your metrics against relevant benchmarks. This could be your game's historical performance, industry averages for similar genres, or goals you set for specific updates. A sudden drop in DAU might be alarming, but less so if it's typical post-update seasonal fluctuation.
Identify Trends, Not Just Spikes: Look for sustained patterns or gradual shifts over time rather than isolated peaks or valleys. A consistent decline in retention over several weeks is far more concerning than a single-day dip.
Segment Your Players: Not all players are created equal. Segmenting your data by demographics, acquisition source, spending habits (e.g., whales vs. free-to-play), or progression stage can reveal vastly different insights. For example, new player retention might be poor, but veteran player engagement could be strong.
Correlation vs. Causation: Be cautious about assuming that because two metrics move together, one causes the other. An increase in a new feature's usage might correlate with a drop in another feature's usage, but this doesn't automatically mean the new feature *caused* the drop; other factors could be at play.
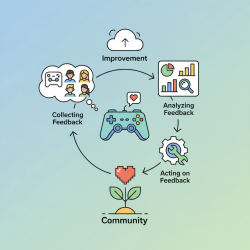
Qualitative Data: Complement quantitative data with qualitative feedback from surveys, community forums, and player support tickets. This helps explain the "why" behind the numbers.
Actionable Insights: Turning Data into Improvement
The ultimate goal of data analysis is to drive action and improve your game. Here's how to translate insights into tangible results:
Prioritize Issues: Data helps you identify the most pressing problems. If D1 retention is low, focus efforts on the onboarding experience. If ARPPU is declining, investigate monetization mechanics or content value.
Inform Design Decisions: Use feature usage data to refine or remove unpopular features, or to double down on highly engaging ones. A/B testing different UI layouts, tutorial flows, or pricing models can provide concrete evidence for what works best.
Iterative Development: Embrace a continuous cycle of hypothesize, measure, learn, and adapt. Make changes based on data, then monitor the impact of those changes on your KPIs. This iterative approach is fundamental to live service games.
Communication Across Teams: Data should not live in a silo. Share key insights with design, engineering, marketing, and community teams to foster a shared understanding of game health and align strategic efforts.
Summary
Navigating the complexities of game development success hinges on a robust understanding of data. This article emphasized that "Metrics That Matter" are quantifiable Key Performance Indicators (KPIs) directly tied to strategic goals, crucial for assessing game health and player engagement. We explored essential KPI categories, including player acquisition and retention, engagement metrics, monetization data, and performance indicators like crash rates. Crucially, we discussed the importance of interpreting data with context, identifying trends, segmenting players, and distinguishing between correlation and causation. Ultimately, the goal is to transform these insights into actionable strategies, enabling developers to prioritize improvements, inform design decisions, and foster an iterative development cycle for sustained game success.
Comprehension questions
 What is the primary purpose of identifying and tracking Key Performance Indicators (KPIs) in game development?Name three essential categories of KPIs discussed in the article and provide an example metric for each.Why is context important when interpreting game data, and what are some factors to consider for proper interpretation?How can game developers transform data analysis into actionable insights to improve their games?
Review Quiz
Next Lesson

Course Contents : Mastering Live Service Games
- >> 5.
 Navigating Game Health and Player Engagement Through Data